
How to Build Zendesk Dashboards and KPI Reports With Claude or ChatGPT
Swifteq's MCP Server connects Claude, ChatGPT, or another AI assistant to your Zendesk, so you can ask for your weekly or monthly support report in plain words. The figures come straight from Zendesk at the moment you ask, from first reply and resolution times to CSAT and ticket counts by group or channel. Claude can then turn them into a dashboard for your team or a one-page summary for leadership.
- KPIs, CSAT, and ticket counts straight from Zendesk
- Dashboards and leadership summaries in Claude
- Reporting only needs read access to your Zendesk
- Ticket conversations and PII from Zendesk are never stored
Free for 500 calls a month per Zendesk account. No credit card required.
Zendesk Dashboard Examples
Each example below starts with one request typed into Claude. The screenshots use a made-up outdoor gear store, Larkspur Outdoor, so the groups, figures, and dates only show the kind of report you'd get.
Compare Last Month's KPIs by Group
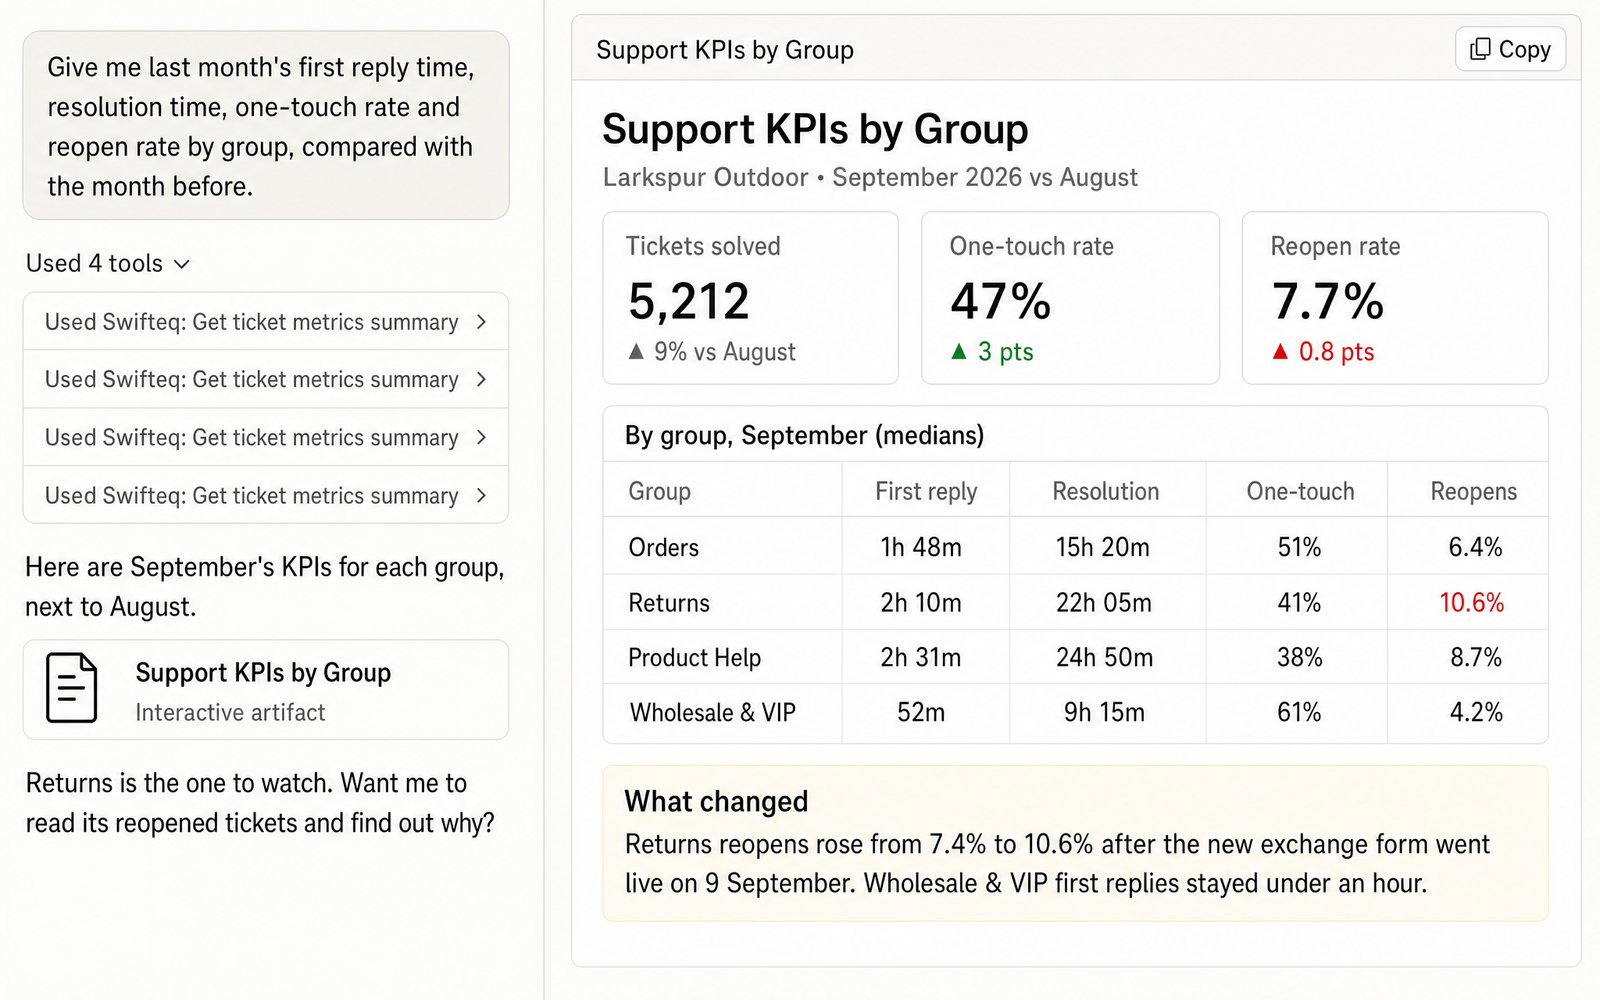
Most monthly reviews start with the same question: how did each group do compared with the month before? Ask Claude, and it gets first reply time, resolution time, one-touch rate, and reopen rate for each group, then puts the two months side by side. It doesn't need to read your tickets one by one for this, because the figures come from the metrics Zendesk already keeps on every ticket. When one number stands out, like a rise in reopens for one group, you can ask Claude to read those tickets and find out why.
- “Give me last month's first reply time, resolution time, one-touch rate and reopen rate by group, compared with the month before.”
Your CSAT Score and the Reasons Behind It
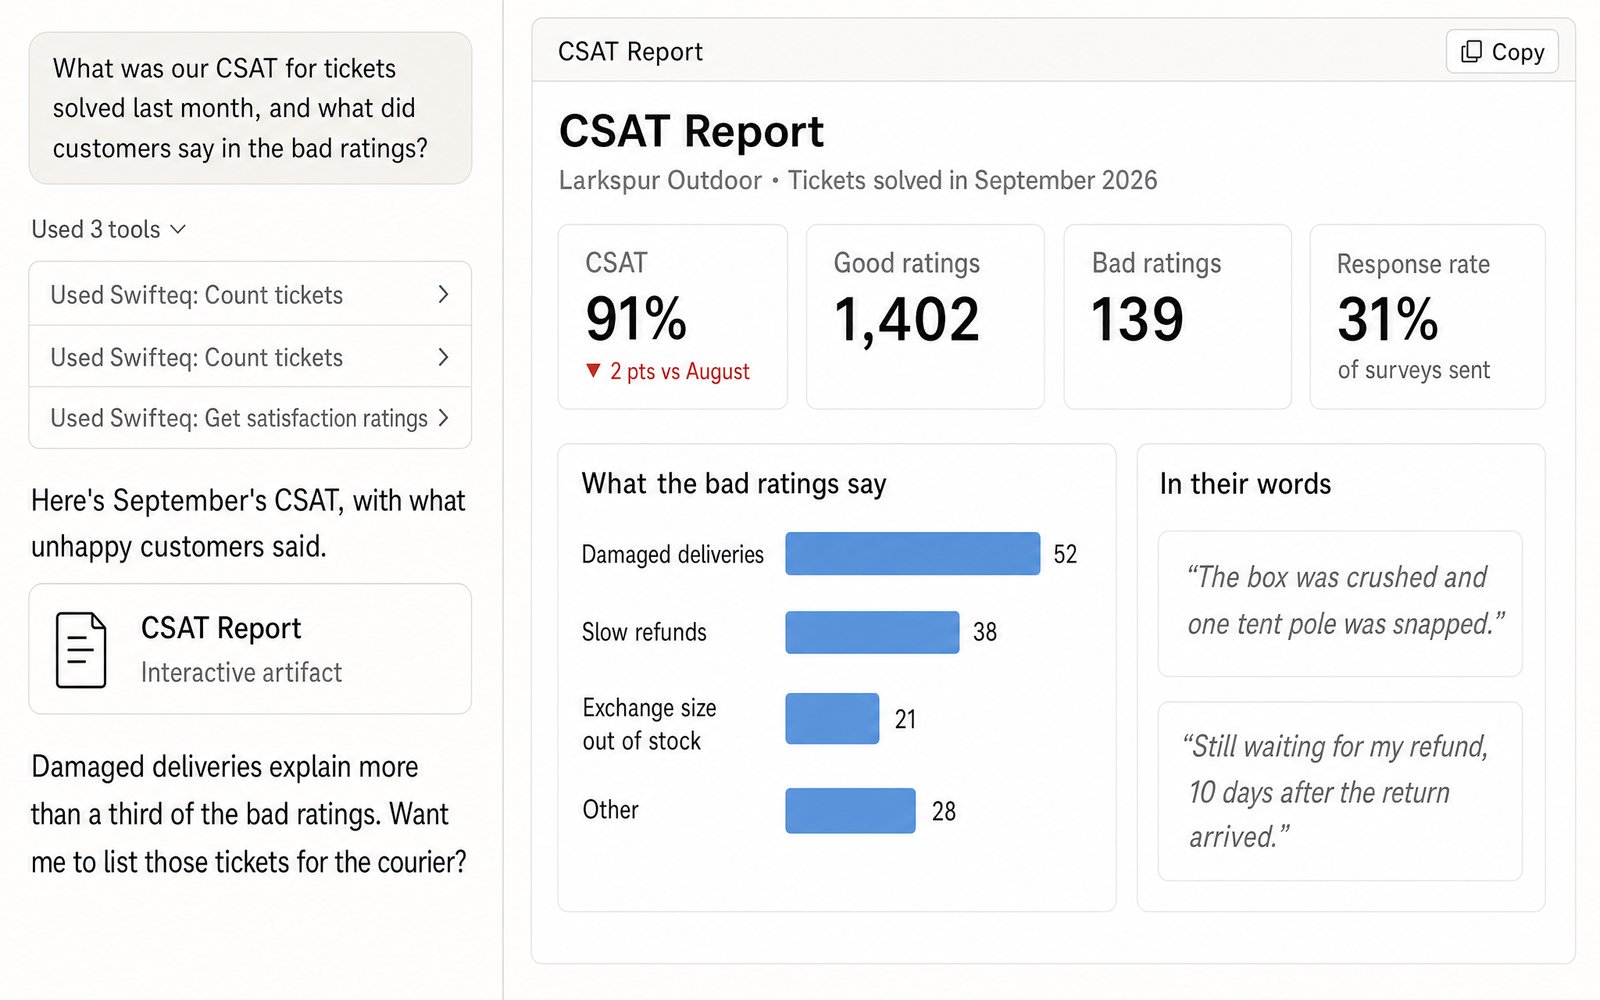
A CSAT score on its own doesn't tell you what to fix. Claude gets the score and the survey response rate in a single call, for the tickets solved in the month you ask about. Then it reads the comments customers left with their bad ratings and sorts them by reason, so you can see what pulled the score down, like damaged deliveries or slow refunds, in your customers' own words.
- “What was our CSAT for tickets solved last month, and what did customers say in the bad ratings?”
A Weekly Summary for Leadership
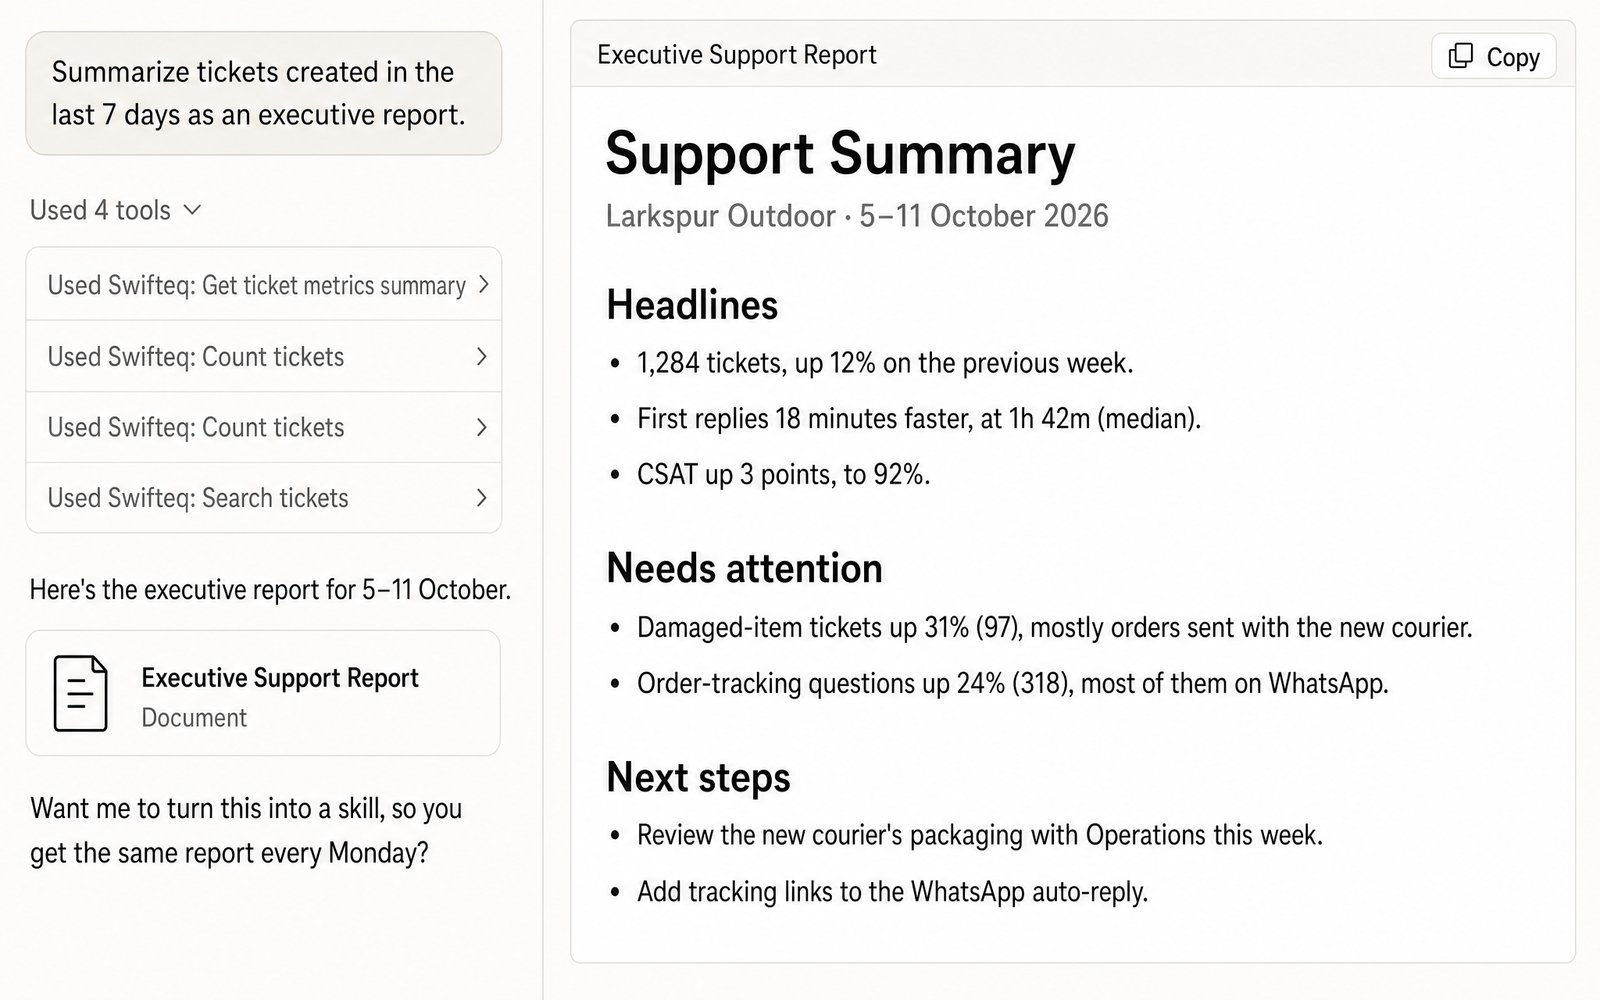
Leadership usually wants one page, not a dashboard. Ask Claude for a weekly summary, and it puts ticket volume, your main KPIs, CSAT, and the main contact reasons together in a short report. Once it looks the way you want, save it as a Claude skill, which is a set of saved instructions Claude follows each time, so you get the same report every week from one prompt.
- “Summarize tickets created in the last 7 days as an executive report.”
What Your Zendesk Reports Can Include
You ask in plain words, and Claude or ChatGPT gets the figures from Zendesk's own ticket metrics at the moment you ask.
Support KPIs
First reply and resolution times, wait times, and one-touch and reopen rates for the week or month you choose, split by group, agent, channel, form, or week.
Ticket counts
How many tickets you got per group, channel, form, priority, brand, dropdown field, or CSAT rating, or per day, week, or month. Each breakdown is one call, however many tickets you have.
CSAT score
Your CSAT score and survey response rate, for the whole team or for one group, brand, or form. It works with Zendesk's legacy ratings and with the newer CSAT surveys.
Dashboards and summaries
A dashboard in Claude for your team, or a one-page summary for leadership. If you save it as a Claude skill, anyone on your team can get the same report from one prompt.
Finding Out Why a Number Changed
A report tells you that first reply time went up or CSAT dropped, but not why. For that, Claude or ChatGPT reads the tickets behind the number, including full conversations from email, messaging, and WhatsApp, and the comments customers left with their CSAT ratings. For example, if ticket volume jumped last week, it can find the contact reasons behind the spike, what's changed since the week before, and which issues are escalating. There are more examples, from contact reasons to sentiment, in how to analyze Zendesk tickets with Claude or ChatGPT.
The KPIs, counts, and CSAT figures above don't depend on how much the AI can read at once, because they're worked out before they reach Claude or ChatGPT, which only sees the results. Reading the tickets themselves does depend on it, so before you ask for a large volume of conversations to be read, have a look at our best practices.
Where the Numbers Come From
Claude or ChatGPT gets the numbers through the Swifteq MCP Server, which asks Zendesk and passes the answer back. Nothing is calculated ahead of time or stored. Each figure comes from Zendesk's own per-ticket metrics and search counts at the moment you ask, and it uses the Zendesk permissions of the person asking.
| Tool | What it gives you |
|---|---|
| get_ticket_metrics_summary | First reply, resolution, and wait times, plus one-touch and reopen rates, for a period, split by group, agent, channel, form, week, or month |
| count_tickets with group_by | The number of tickets per group, channel, form, priority, brand, field option, day, week, or month |
| count_tickets with group_by: satisfaction | The CSAT score, the number of good and bad ratings, and the response rate |
Limits to know
| Limit | What it means |
|---|---|
| 3,000 tickets per metrics call | A busier month takes two calls. Averages and rates can be combined across calls, but medians can't |
| 31 days with a daily trend | For a longer period, ask for the figures by week or by month |
| 200 values per grouped count | A year counted day by day is too many values, so count by week or month instead |
| No counts by tag, organization, requester, or assignee yet | The AI counts those one value at a time instead. Times and rates can still be split by agent |
| 1,000 rows per CSV export | For a longer list of tickets, the AI exports them in batches |
| Days follow the connected user's timezone | If a report's days look shifted, check the timezone in that user's Zendesk profile |
How it works
Set It Up in Three Steps
- 1
Create your free Swifteq account
Sign up and authorize your Zendesk account. Read access is all you need for reports and dashboards.
- 2
Add the connector to your AI assistant
In Claude or ChatGPT, add a custom connector with the URL
https://mcp.swifteq.com/api/mcp/mcpand sign in with your Swifteq account. - 3
Ask for your first report
For example: “What were our first reply time and CSAT last week?” Zendesk only shows CSAT to admins, so if you want CSAT in your reports, connect with an admin login.
Frequently Asked Questions
Can it build a Zendesk dashboard?
Yes, in Claude. Ask for a dashboard and Claude builds one next to the chat, using the figures it just got from your Zendesk. When it looks right, save it as a Claude skill, so you can run it again each week with one prompt. ChatGPT and other assistants give you the same figures as tables and summaries instead.
Which Zendesk metrics can it report?
It reports first reply time, first and full resolution time, requester wait time, agent wait time, and on-hold time. Each one comes as a median, an average, and a 90th percentile, in both calendar and business hours. You also get reopen and one-touch rates. First reply time counts every ticket an agent has replied to, while the other figures count solved tickets only.
How is the Zendesk CSAT score calculated?
It's the number of good ratings divided by good plus bad. Tickets are picked by when they were solved (or created) in the period you ask about, not by the day the customer rated them, so for last month's CSAT you'd ask about tickets solved last month. The response rate is the share of tickets sent the survey that got a rating. It works with legacy ratings and with CSAT surveys, but keep in mind that Zendesk records a survey answer of 4 or 5 as good and 1 to 3 as bad, so neutral answers lower the score.
Can it report SLA achievement?
Yes, with a separate tool. It works out the percentage achieved for each SLA metric in your own Zendesk SLA policies, split by group, agent, or week, and lists the tickets that breached. See Zendesk SLA tracking with Claude or ChatGPT.
How many calls does a report use?
Each figure or breakdown takes one call, so a report with your KPIs, ticket counts by channel, and CSAT uses three calls. Reading tickets to find contact reasons adds a call for each page of up to 100 tickets, or for each conversation it reads.
What does it cost?
It's free for 500 calls a month per Zendesk account, shared by everyone at your company. Above that, €49 a month covers your account and its first user, and each extra user is €9 a month, so a team of 10 pays €130 a month. See pricing.
Guides and Resources
Ask for Your First Zendesk Report
Free for 500 calls a month. No credit card required.
Page last updated